In 1921, Albert Einstein won his first and only Nobel prize for his work on describing the photoelectric effect.
Light (a beam of particles) knocks loose electrons from the solar cell, the solar cell then directs these electrons along a current – creating electricity. The electrons leave a ‘hole’, the electrons can then be sent back to the solar cell by completing the circuit. In theory, solar panels could last forever as there are no moving parts.
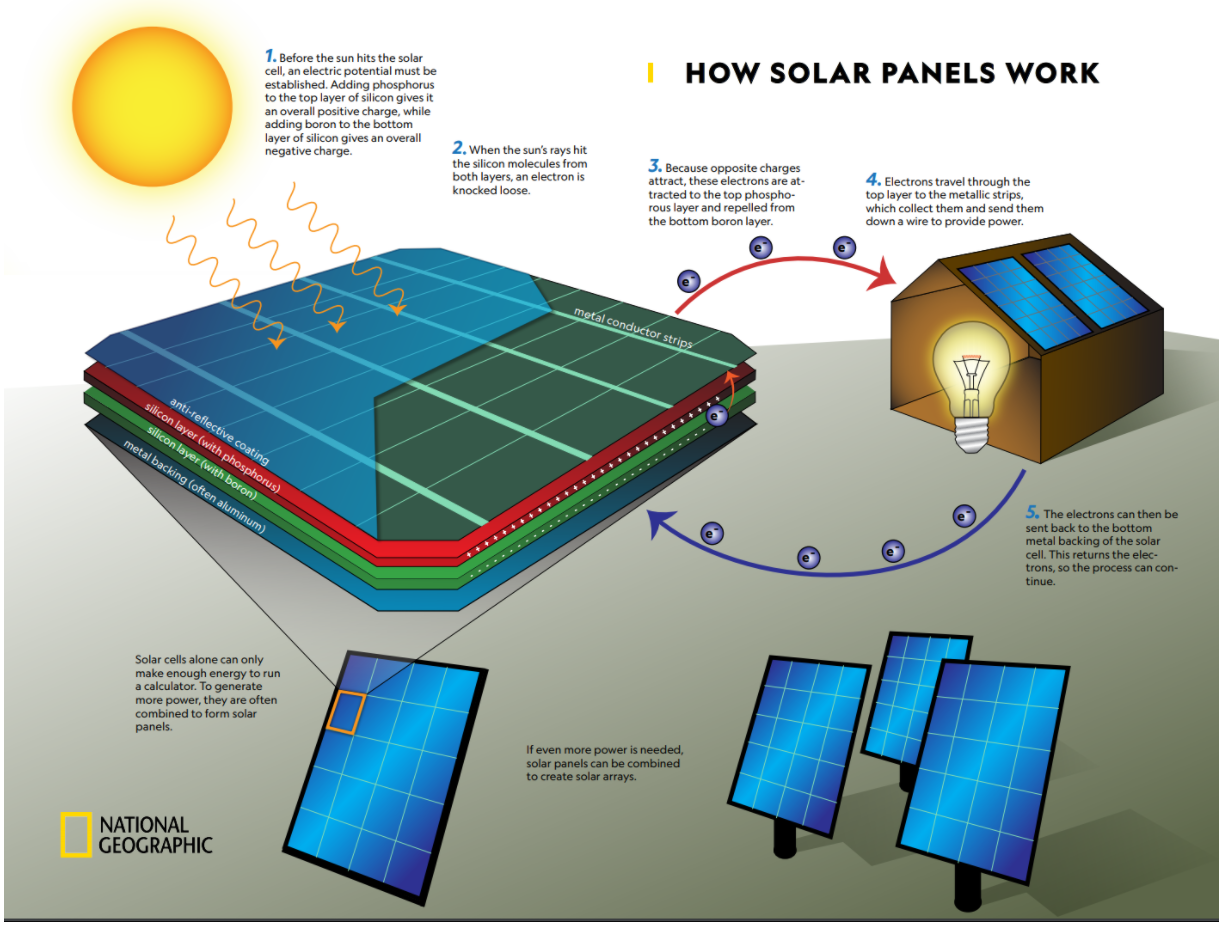
Below is a useful graphic from National Geographic describing how solar cells work. Between 60 and 72 solar cells are combined to create a domestic solar panel.
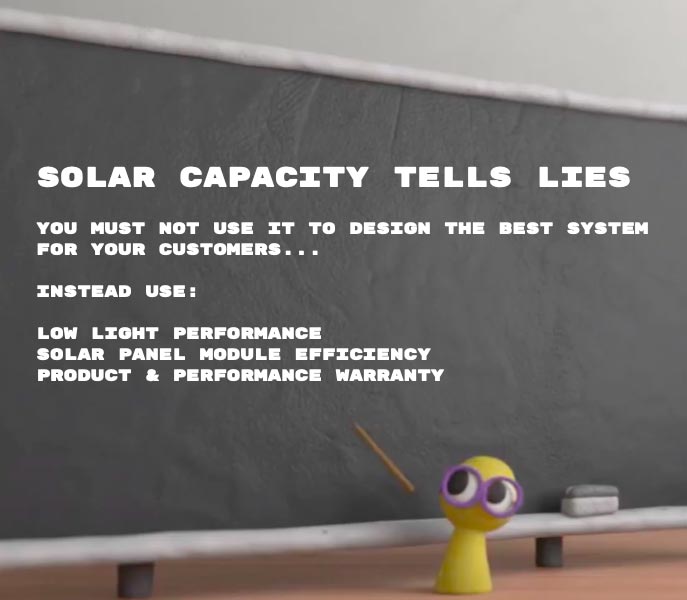
Recent improvements in technology mean modern premium panels will have half-cells (120-144) to make up a solar panel – this improves efficiency. You can fit more cells in a given area and enable better shading and low light performance.
Video transcript:
How do solar panels work? step by step
Did you know?… In 1921, Albert Einstein won his first and only Nobel prize for describing the (solar) photovoltaic effect.
A solar cell has two layers. the top layer has a positive charge, the bottom layer negative…
When light hits the silicon molecules, an electron is knocked loose… these electrons are attracted to the top positive layer and repelled by the negative layer…
Electrons travel through the top layer to metallic strips that collect them and send down a wire to provide power
This flow of electrons is electricity! the electrons can then be sent back to the metal backing of the cell…completing the circuit.
In theory, solar cells could provide power forever.